How to Calculate Standard Deviation and Variance (Sample vs Population)
Learn how to find the mean, variance and standard deviation of a data set, the difference between sample and population formulas, with a worked example.

The average alone does not describe a set of numbers. Two classes can both average 70 marks, but in one every student scored between 65 and 75 and in the other marks ranged from 30 to 100. Standard deviation measures that spread. The free Standard Deviation Calculator gives it, along with the mean, median, variance and range.
Quick answer
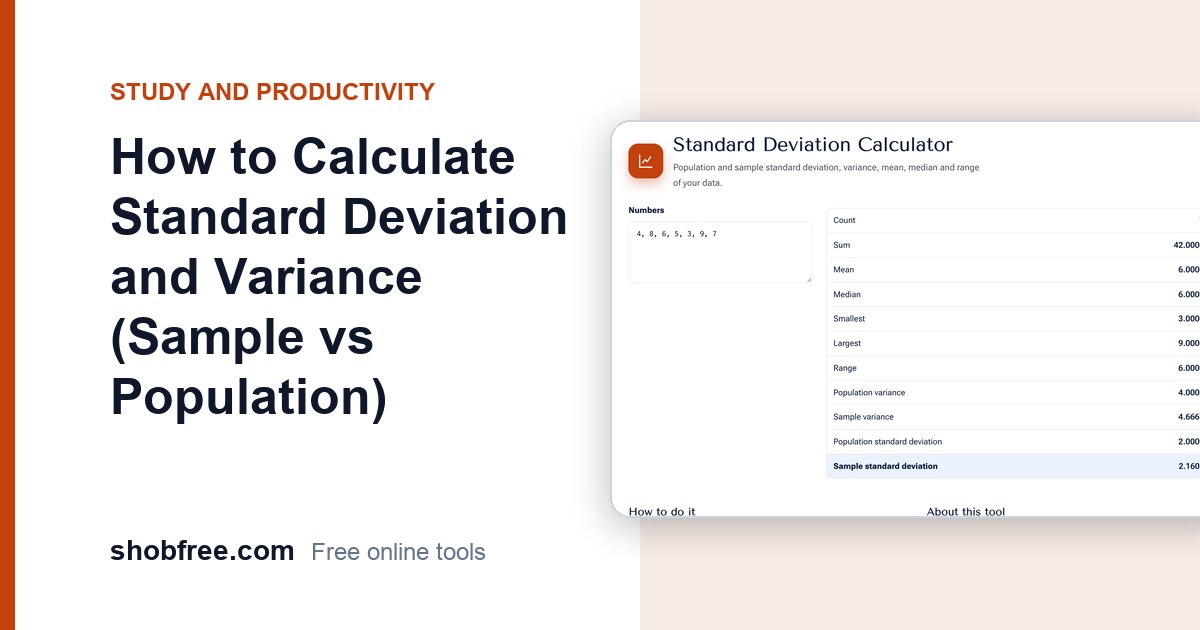
Standard deviation is the typical distance of the values from the mean. For the data 4, 8, 6, 5, 3, 7, 9 the mean is 6, the population standard deviation is 2 and the sample standard deviation is about 2.16.
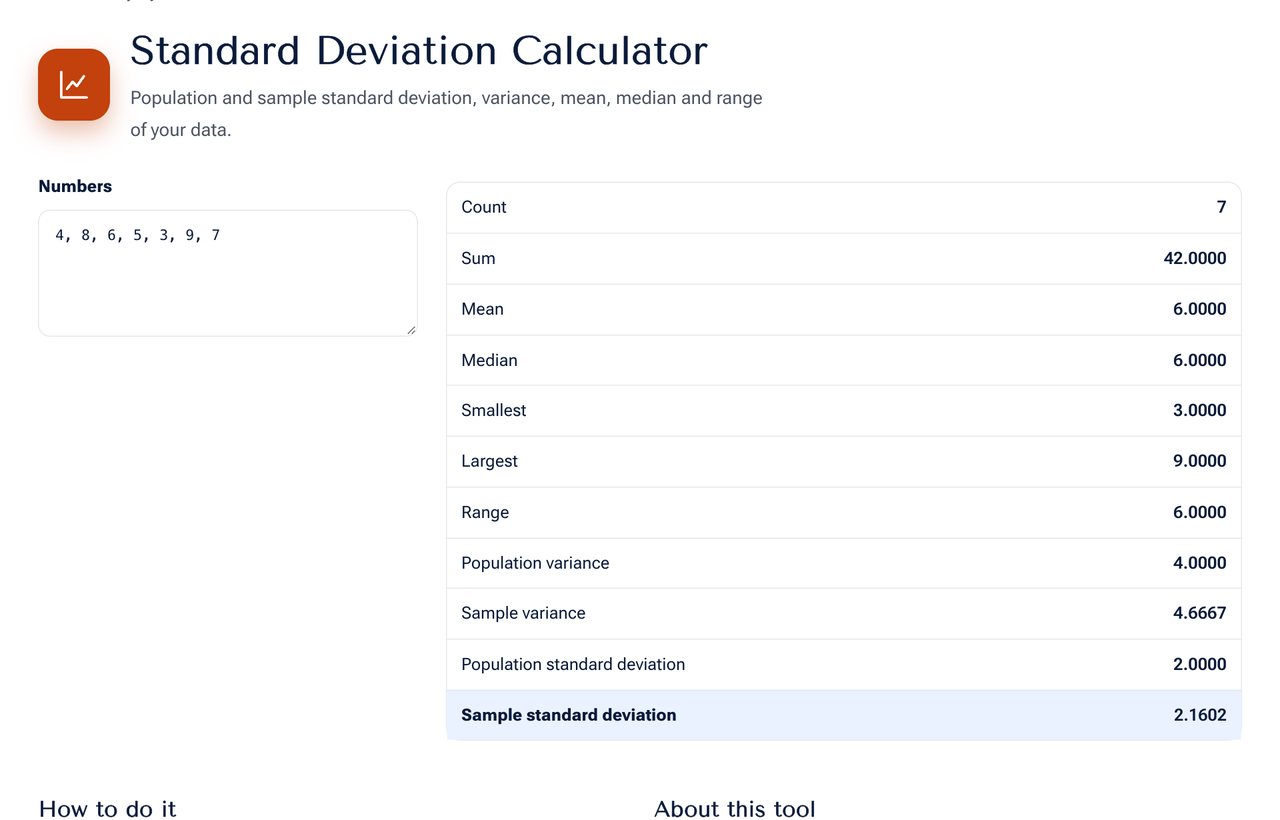 The Standard Deviation Calculator showing count, mean, variance and both standard deviations.
The method, step by step
Data: 4, 8, 6, 5, 3, 7, 9 (n = 7).
- Mean: (4 + 8 + 6 + 5 + 3 + 7 + 9) / 7 = 42 / 7 = 6.
- Deviations from the mean: −2, 2, 0, −1, −3, 1, 3.
- Squares of the deviations: 4, 4, 0, 1, 9, 1, 9. Their sum is 28.
- Variance: population = 28 / 7 = 4. Sample = 28 / 6 = 4.667.
- Standard deviation: the square root of the variance. Population = 2. Sample = 2.160.
Population or sample?
- Use the population formula (divide by n) when your data includes every member of the group, such as the marks of all 40 students in a class that you are describing.
- Use the sample formula (divide by n − 1) when your data is a part of a larger group and you want to estimate the spread of the whole, such as a survey of 100 customers out of 10,000.
Dividing by n − 1 makes the estimate unbiased. For large samples the difference is small, and for small samples it matters.
How to interpret it
For data that is roughly bell-shaped:
- About 68 percent of values lie within one standard deviation of the mean.
- About 95 percent lie within two.
- About 99.7 percent lie within three.
If the mean exam mark is 60 with a standard deviation of 10, most students scored between 50 and 70, and nearly all between 40 and 80.
Uses in everyday life
- Education: comparing the spread of marks between classes.
- Business: measuring how much daily sales vary, which helps plan stock.
- Quality control: checking that products stay within tolerance.
- Finance: volatility of an investment's returns.
- Health: how much blood pressure readings vary over a week.
Common mistakes
- Using the population formula for a small sample.
- Mixing units, such as hours and minutes, in one list.
- Ignoring outliers. A single extreme value can inflate the standard deviation, so check the data first.
- Comparing standard deviations of data with very different means without considering the relative size.
Related measures
The variance is the square of the standard deviation. The range is the largest value minus the smallest. The median is the middle value and is less affected by outliers. The calculator shows all of these together.
Frequently asked questions
Can the standard deviation be negative? No. It is a square root and is zero or positive.
What does a standard deviation of zero mean? Every value is the same.
How many numbers do I need? At least two for the sample formula. More numbers give a more reliable estimate.
Next step
Paste your numbers into the Standard Deviation Calculator. For the average of a list use the Average Calculator.